Experiments with Geographical Information System (GIS) central places

Description
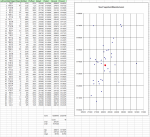
This was an experiment using ACAD LT and the commonly used UBD street directory. UBD map grid references are transformed into Australian Map Grid (AMG) coordinates, and then able to be plotted into ACAD, or plotted on Excel XY chart. VBA macro is used to scan all the location points one at a time, and if within 5km of each other, a simple line defined between the two. This then transformed into ACAD script in the workbook, then copy pasted to ACAD to draw the lines between the locations. The example shows location of Shed Suppliers in Adelaide. Better still is to modify the VBA routines and use nearest neighbours, and triangulation. The 5km radius was chosen because it was a simple approach and 5km/hr is average walking speed: so it connects suppliers within 1 hours walking distance. Or otherwise identifies a lack of facilities in walking distance. Change the data. I have versions with churches, shopping centres, consulting engineers, and location of my projects. Just using Excel alone is a simple way to get a picture. Don't really need maps to over lay. In ACAD I just have the UBD map grid, and that alone is provides useful information, when data points plotted over.
Calculation Preview
Full download access to any calculation is available to users with a paid or awarded subscription (XLC Pro).
Subscriptions are free to contributors to the site, alternatively they can be purchased.
Click here for information on subscriptions.

