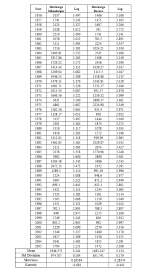
Flood Frequency Analysis By Gumble & Log Pearson III

Description
Flood frequency analysis is a technique used by hydrologists to predict flow values corresponding to specific return periods or probabilities along a river. The application of statistical frequency curves to floods was first introduced by Gumbel. Using annual peak flow data that is available for a number of years, flood frequency analysis is used to calculate statistical information such as mean, standard deviation and skewness which is further used to create frequency distribution graphs. The best frequency distribution is chosen from the existing statistical distributions such as Gumbel, Normal, Log-normal, Exponential, Weibull, Pearson and Log-Pearson. After choosing the probability distribution that best fits the annual maxima data, flood frequency curves are plotted. These graphs are then used to estimate the design flow values corresponding to specific return periods which can be used for hydrologic planning purposes. Flood frequency plays a vital role in providing estimates of recurrence of floods which is used in designing structures such as dams, bridges, culverts, levees, highways, sewage disposal plants, waterworks and industrial buildings . In order to evaluate the optimum design specification for hydraulic structures, and to prevent over-designing or under designing, it is imperative to apply statistical tools to create flood frequency estimates. These estimates are useful in providing a measurement parameter to analyze the damage corresponding to specific flows during floods. Along with hydraulic design, flood frequency estimates are also useful in flood insurance and flood zoning activities. Accurate estimation of flood frequency not only helps engineers in designing safe structures but also in protection against economic losses due to maintenance of structures.
Calculation Reference
Flood
Flood Frequency Analysis
Gumble & Log Pearson III
Flood Frequency Analysis is a method used to estimate the probability of flood events of different magnitudes occurring at a specific location. It helps engineers and planners to design hydraulic structures and flood control measures. Two commonly used methods for flood frequency analysis are the Gumbel distribution and the Log Pearson Type III distribution.
-
Gumbel Distribution: The Gumbel distribution, also known as the Extreme Value Type I distribution, is widely used in hydrology to model extreme events like floods and droughts. It is a univariate distribution, which means it considers only one variable, such as annual peak flow or maximum flood levels. Gumbel distribution parameters are estimated using observed data, and the probability of a certain flood magnitude is calculated.
-
Log Pearson Type III Distribution: The Log Pearson Type III distribution is another method used for flood frequency analysis. It is a three-parameter distribution, making it more flexible than the Gumbel distribution. The method involves taking the logarithm of the observed data, which helps to normalize the data and better represent the variability in flood magnitudes. The parameters of the Log Pearson Type III distribution are estimated using the moments method, and probabilities for different flood magnitudes are determined.
Both methods, Gumbel and Log Pearson Type III, are used to estimate the frequency and magnitude of flood events, allowing engineers and planners to design appropriate hydraulic structures and flood control measures to mitigate potential flood risks. The choice between these methods depends on the dataset characteristics and the specific requirements of the analysis.
Calculation Preview
Full download access to any calculation is available to users with a paid or awarded subscription (XLC Pro).
Subscriptions are free to contributors to the site, alternatively they can be purchased.
Click here for information on subscriptions.


