Properties of Dry Air.xls

Description
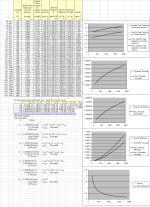
The properties of dry air at various temperatures. Specific Heat Capacity at constant pressure. Specific Heat Capacity at constant volume Dynamic Viscosity Thermal Conductivity Thermal Diffusivity Kinematic Viscosity Density Third order polynomial formulae are developed so that any property can be calculated for a given temperature.
Calculation Reference
Properties of fluids and gases
Properties of air
In Excel, you can use the polynomial curve fitting function to read graphical charts and obtain a polynomial equation that best fits the data. Here's a step-by-step guide:
-
Enter the data points: In Excel, input the data points from the graphical chart. List the x-values in one column (e.g., A2:A10) and the corresponding y-values in the next column (e.g., B2:B10).
-
Create a scatter plot: Select the data points (both x and y values), then go to the 'Insert' tab, click on the scatter plot icon, and choose 'Scatter.' This will create a scatter plot of the data points in your chart.
-
Add a polynomial trendline: Click on any data point in the scatter plot to select the series. Then, right-click on the selected data point and choose 'Add Trendline...' from the context menu. In the 'Format Trendline' pane that appears, select 'Polynomial' under 'Trendline Options.' You can adjust the 'Order' field to set the degree of the polynomial equation (e.g., 2 for a quadratic, 3 for a cubic).
-
Display the equation on the chart: In the 'Format Trendline' pane, check the box for 'Display Equation on chart.' The polynomial equation that best fits the data points will appear on the chart.
-
(Optional) Adjust the trendline: If necessary, you can adjust the trendline by changing its order or by selecting other options in the 'Format Trendline' pane, such as setting the line color or style.
Now you have a polynomial curve fitting equation that can be used to read or predict values from the graphical chart. To use the equation for specific x-values, input the x-value into the equation, and calculate the corresponding y-value.
Calculation Preview
Full download access to any calculation is available to users with a paid or awarded subscription (XLC Pro).
Subscriptions are free to contributors to the site, alternatively they can be purchased.
Click here for information on subscriptions.


